The January data for the £1,000,000+ market across South Buckinghamshire and Henley-on-Thames provides a clear indication of how 2026 is beginning to unfold.
| Metric | Jan 2021 | Jan 2022 | Jan 2023 | Jan 2024 | Jan 2025 | Jan 2026 | Average |
|---|---|---|---|---|---|---|---|
| Properties for sale | 496 | 352 | 491 | 598 | 713 | 740 | 565 |
| New Listings | 64 | 81 | 99 | 101 | 108 | 146 | 100 |
| Sales Agreed | 58 | 45 | 47 | 48 | 40 | 45 | 47 |
| Price Changes | 45 | 17 | 34 | 38 | 48 | 47 | 38 |
| Withdrawn | 36 | 27 | 42 | 44 | 55 | 42 | 41 |
| Fall-Throughs | 11 | 10 | 17 | 10 | 14 | 16 | 13 |
Supply Is the Defining Theme
The defining characteristic of January 2026 is not price volatility, but supply expansion.
There are currently 740 properties listed above £1,000,000, compared with 713 at the same point last year and 598 in January 2024. Buyers now have materially more choice than at any January point in the past six years.
That shift in balance inevitably influences negotiating leverage and marketing timelines.
New Listings and Pricing
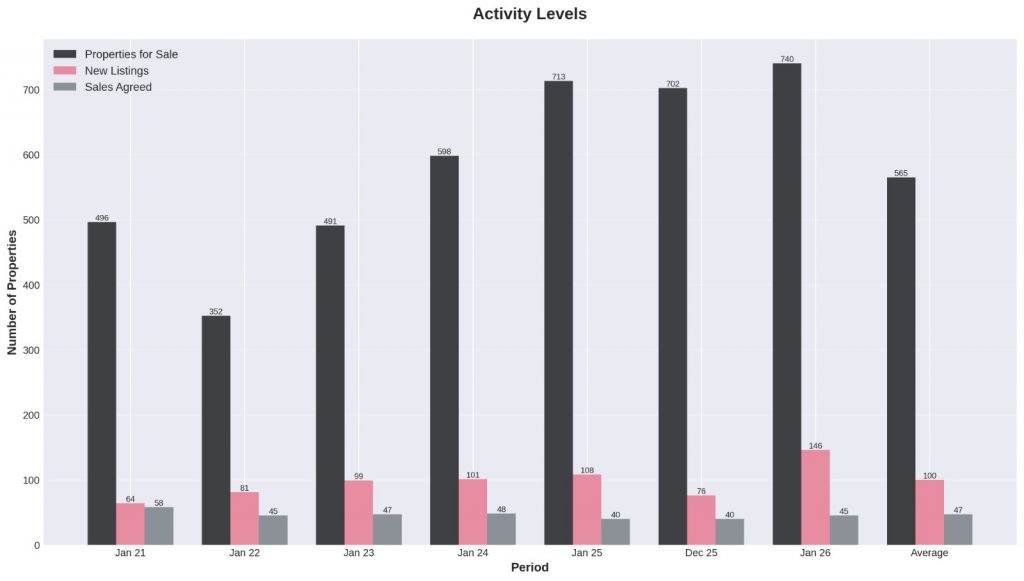
January saw 146 new £1m+ properties come to market, the highest January figure in the dataset.
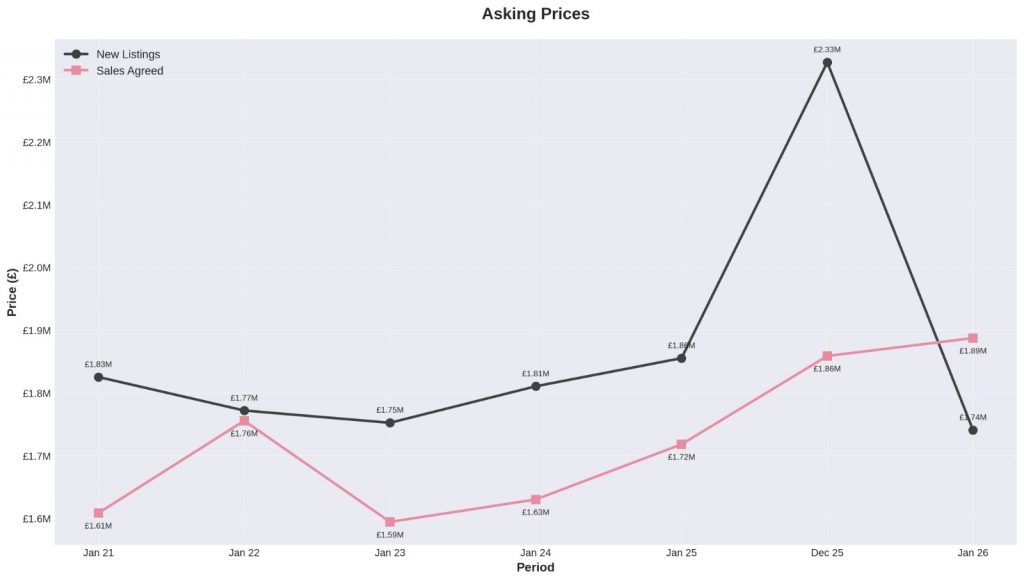
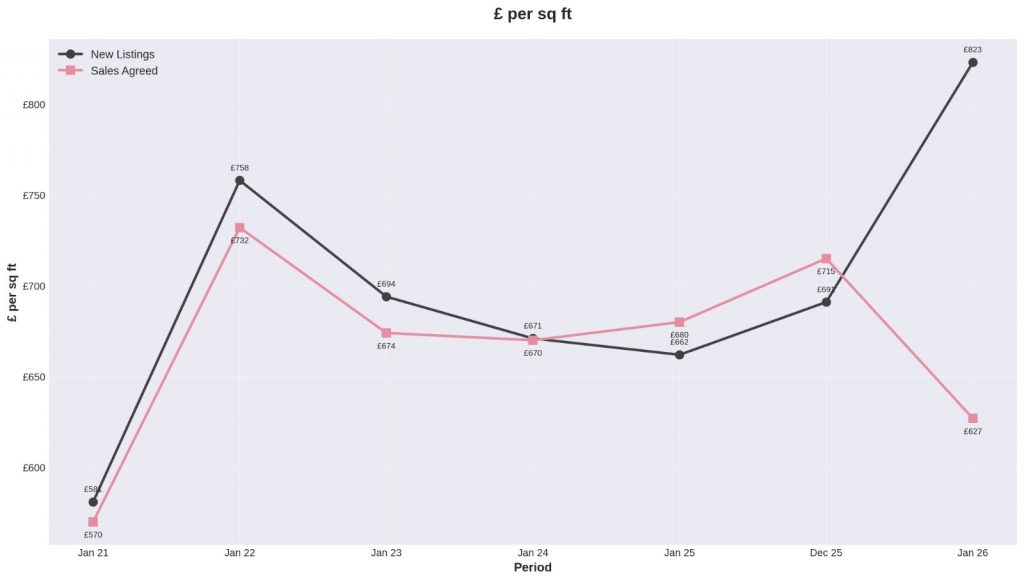
The average asking price of those new listings was £1,740,869, equating to £823 per square foot.
On the surface, asking prices remain robust. However, asking figures alone do not define direction. Agreed sales provide a clearer view of real-time sentiment.
Sales Agreed and Achieved Values
During January, 45 properties achieved sales agreed status across the region.
The average agreed price per square foot was £627.
The difference between the average asking figure of £823 and the agreed figure of £627 represents a gap of almost 24 percent. That spread highlights how sensitive this market has become to initial positioning.
At the £1m+ level, buyers tend to be well advised and evidence-led. Where pricing is perceived to sit ahead of comparable agreed evidence, activity can slow quickly, leading to reductions or withdrawal.
Price Adjustments, Withdrawals and Fall Throughs
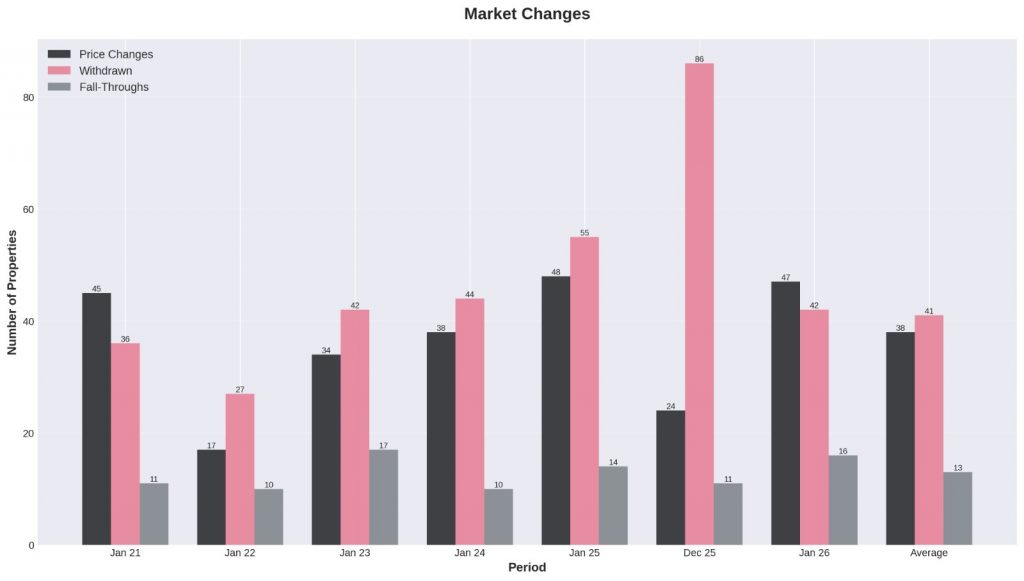
January recorded 47 price reductions and 42 withdrawals.
While withdrawals were slightly lower than December, they remain elevated relative to longer-term averages. This typically reflects an initial mismatch between pricing expectations and buyer appetite.
There were also 16 fall-throughs during the month. At this level, transactions frequently involve complex chains, larger mortgage requirements and detailed surveys. Careful progression remains critical.
Regional Context
Taken together, the data suggests that the South Buckinghamshire and Henley premium market is neither overheated nor distressed.
Supply has increased.
Seller confidence appears steady.
Buyer behaviour remains cautious but active.
The market is functioning, but it is selective.
Homes that launch with reference to recent agreed evidence are progressing. Those positioned optimistically are experiencing longer marketing periods. In a market defined by increased supply rather than reduced demand, strategy at launch has become the decisive factor.
Local Area Breakdown
Marlow (SL7) – Premium Positioning, Longer Timelines
Marlow currently has 73 homes available above £1m, with an average asking price of £2.02m. The average £ per sq ft stands at £1,000, reinforcing its position as the highest priced of the three markets on a price-per-foot basis.
However, the average time on market has extended to 174 days. Four properties secured buyers in January, demonstrating that transactions are progressing, but selectively.
Marlow continues to command premium pricing, particularly in central and riverside locations. The data indicates that momentum is concentrated in homes launched accurately, with pricing discipline playing an increasingly important role.
Henley-on-Thames (RG9) – Measured and Balanced
Henley currently has 85 homes available above £1m, with an average asking price of £1.90m and an average £874 per sq ft.
The average time on market is 116 days, shorter than Marlow and closer to the regional norm. Three properties secured buyers in January, reflecting steady but measured turnover.
Henley’s market appears balanced rather than overheated. Pricing expectations remain broadly aligned with buyer appetite, but the margin for over-optimism is limited. As with the wider region, evidence-based positioning is proving more effective than aspirational pricing.
Beaconsfield (HP9) – Strongest Turnover at £1m+
Beaconsfield has the largest volume of premium stock, with 117 homes available above £1m. The average asking price is £2.15m, while the average £ per sq ft sits at £757, reflecting generally larger plots and family housing stock.
The average time on market is 127 days, broadly in line with Henley. Notably, eight properties secured buyers in January, making HP9 the most active of the three markets at this price level.
While stock levels are substantial, buyer depth in Beaconsfield appears comparatively resilient. Well-presented family homes at realistic price points continue to transact despite the increased supply.
* Postcodes: RG9, SL2, SL7, SL8, SL9, HP6, HP7, HP9, HP14 . Premium properties = £1m+