March 2026 (Based on February Data)
The £1m+ property market across South Buckinghamshire and Henley is beginning to take a clearer shape as we move into spring.
The first few months of the year often provide the most useful signals. Buyers return with intent, sellers commit to decisions made over winter, and the balance between supply and demand starts to reveal itself more honestly. February 2026 is no exception, and the data points to a market that is both active and increasingly selective.
| Metric | Feb 2021 | Feb 2022 | Feb 2023 | Feb 2024 | Feb 2025 | Feb 2026 | Average |
|---|---|---|---|---|---|---|---|
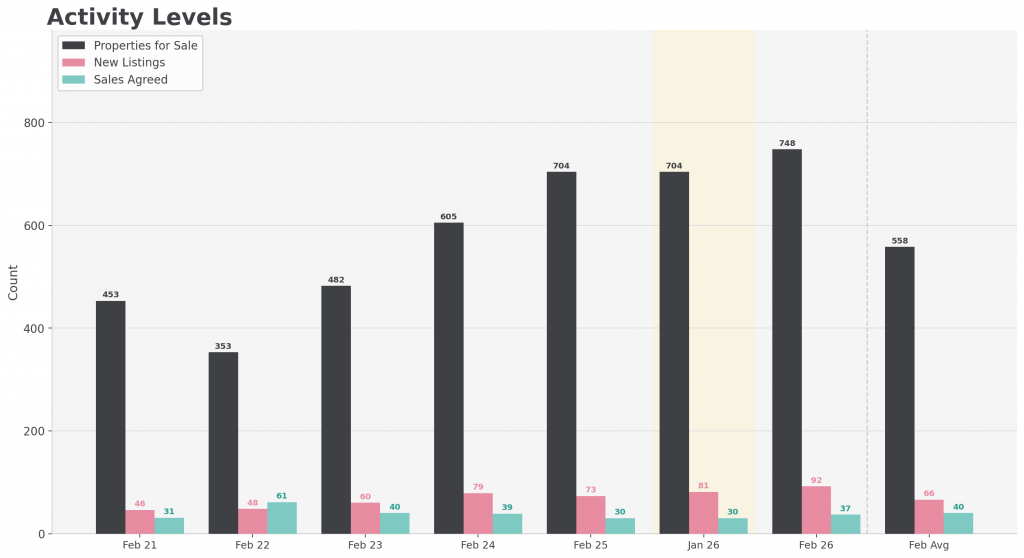
| Properties for sale | 453 | 353 | 482 | 605 | 704 | 748 | 558 |
| New Listings | 46 | 48 | 60 | 79 | 73 | 92 | 66 |
| Sales Agreed | 31 | 61 | 40 | 39 | 30 | 37 | 40 |
| Price Changes | 18 | 12 | 20 | 30 | 36 | 33 | 25 |
| Withdrawn | 29 | 20 | 31 | 41 | 32 | 41 | 32 |
| Fall-Throughs | 7 | 9 | 6 | 2 | 8 | 8 | 7 |
Supply at a Six-Year High
There are now 748 properties available above £1m across South Bucks and Henley. That is the highest level of stock recorded in the dataset and sits approximately 34% above the six-year average.
To put that into context, February 2022 saw just 353 properties available. In practical terms, the amount of choice in the market has more than doubled in four years.
New listings also remain elevated, with 92 properties entering the market in February. This is the highest February figure in the dataset and continues the pattern seen in January. Sellers are clearly active and many appear confident about testing the market as we move into the spring window.
The consequence is straightforward. Buyers now have more choice than they have had for several years, and that inevitably changes how decisions are made
Asking Prices and Value Positioning
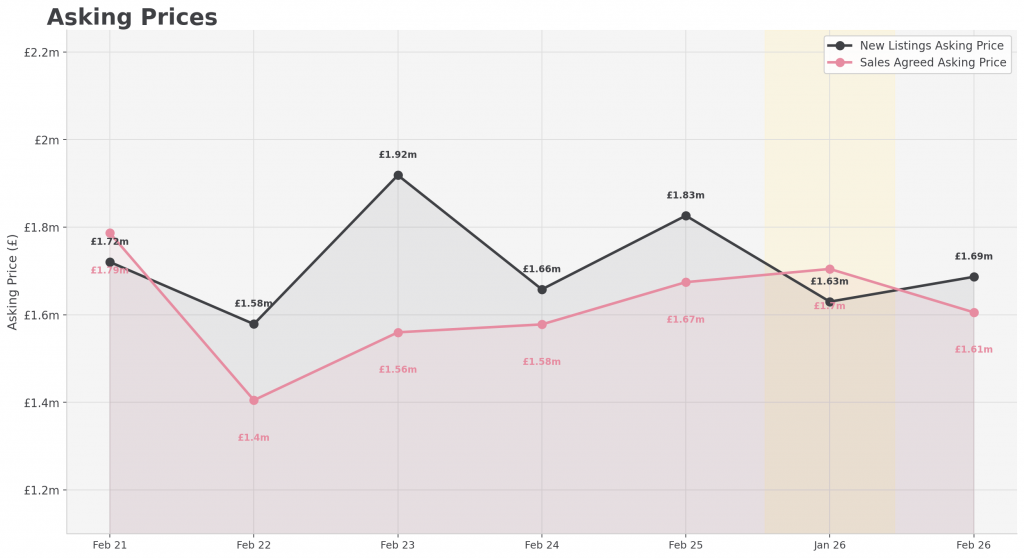
The average asking price for new listings in February sits at £1,686,500.
At face value, this appears softer than the equivalent figures in 2023 and 2025. However, headline averages can be misleading, particularly in a market where the mix of properties coming to market varies from month to month.
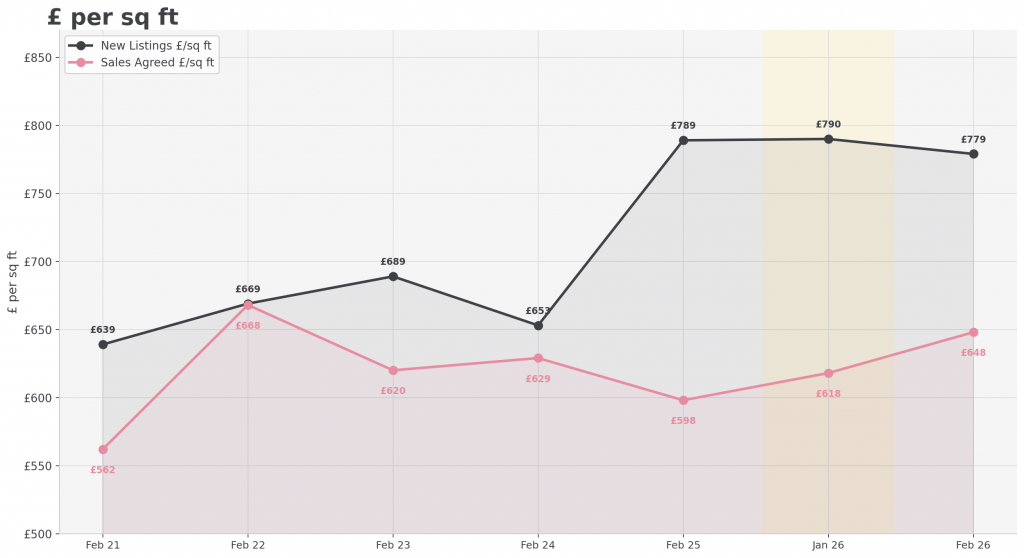
The more reliable measure is price per square foot.
New listings in February averaged £779 per sq ft, which sits very close to recent months and broadly in line with the past year. This suggests that, despite fluctuations in headline pricing, the underlying view of value at the point of instruction has remained relatively stable.
For homeowners, this is an important distinction. The structure of the market has not weakened in any meaningful way, but the way properties are being positioned within it has become more varied.
Sales Agreed: A Market That Is Functioning
February recorded 37 sales agreed across the £1m+ market.
That is an improvement on January and above February 2025, although still slightly below longer-term averages. In the context of 748 available properties, it reflects a market that is functioning, but not rushing.
What stands out more clearly is the achieved pricing.
Agreed sales reached an average of £648 per sq ft in February, the highest level recorded in this dataset and up from £627 in January. This is a meaningful shift.
While supply has increased, the properties that are successfully finding buyers are doing so at stronger levels than we have seen in recent years.
This is where the nuance sits.
It is not a case of a weak market. It is a case of a selective one.
Pricing Discipline and Market Behaviour
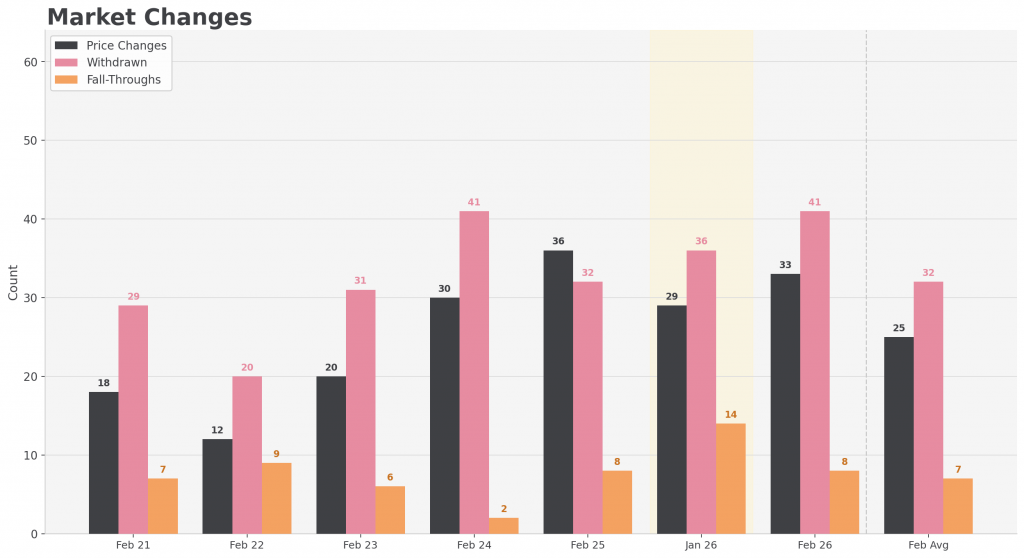
The February data on price changes and withdrawals gives a clear indication of how this selectivity is playing out.
There were 33 price reductions during the month, alongside 41 withdrawals.
Both figures sit above long-term averages and reflect a pattern that has been building over the past 12 to 18 months. Properties are coming to market, being tested, and in some cases being repositioned or removed when expectations are not met.
This is not unusual in a market with elevated supply, but it does underline an important point.
Initial pricing now carries more weight than it has done for some time.
In a market where buyers have genuine choice, there is less tolerance for properties that are positioned ahead of the evidence.
What This Means for Buyers
For buyers, the current conditions are the most favourable we have seen in several years.
With 748 properties available, there is genuine breadth of choice across locations, property types and price points within the premium bracket. That allows for more considered decision-making, more detailed due diligence and, in many cases, greater scope for negotiation.
However, the rise in achieved £ per sq ft at the point of agreement is an important counterbalance.
The best properties, particularly those in the strongest locations, are still attracting meaningful interest and, in some cases, competition. Buyers who are well prepared and understand the local benchmarks are still best placed to secure them.
What This Means for Sellers
For sellers, the message is more exacting.
There is clear evidence of demand. Transactions are happening and achieved values are strong. However, there is also clear evidence of competition.
With stock levels at a six-year high, no property is operating in isolation. Buyers are comparing options closely and making decisions accordingly.
The difference between success and stagnation is increasingly defined by how a property is positioned at launch. Pricing needs to be grounded in current evidence, not past market conditions, and presentation needs to meet the expectations of a more discerning buyer pool.
In this environment, precision matters.
Looking Ahead
As we move further into the spring market, the current conditions suggest a continuation of this pattern.
Supply remains elevated.
Buyer demand remains present.
Outcomes are increasingly dependent on alignment between the two.
The £1m+ market across South Bucks and Henley is not slowing. It is simply operating with greater scrutiny.
For those who understand that, whether buying or selling, the opportunities remain very much in place.
* Postcodes: RG9, SL2, SL7, SL8, SL9, HP6, HP7, HP9, HP14 . Premium properties = £1m+